Benjamin Landy is a former policy associate at The Century Foundation, where he wrote about income inequality, college access and affordability, retirement security, and domestic politics. He contributes to TCF’s Graph of the Day feature and holds a B.A. from Columbia University, where he studied 19th and 20th century American history.

Benjamin Landy
Contributor
Latest Work

Why It’s Time for Colleges to Rethink the SAT
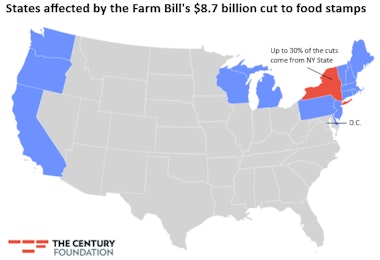
Why Obama Just Cut Food Stamps By $8.7 Billion
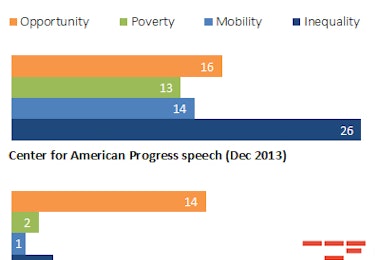
GOTD: Inequality Is Not A Four Letter Word
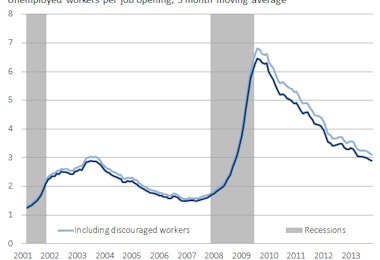
GOTD: Why Unemployed Workers Can’t Just “Get a Job”
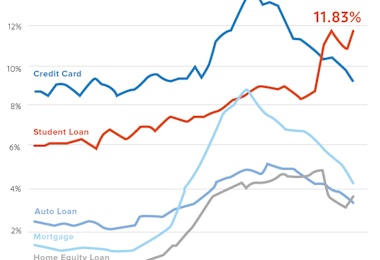
GOTD: The Increasing Cost of Higher Education
See Jane Default
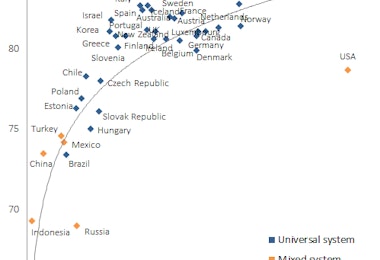
GOTD: American Health Care Is Exceptional—Not in a Good Way

How Asset Tests Punish the Poor