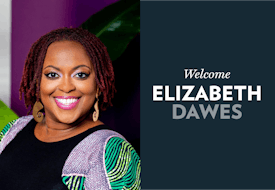
Blog of the Century

Posts about Graph of the Day

Rising Health Care Costs Are Quietly Strangling the Middle Class

Blog Post by: Benjamin Landy, on May 6, 2013

Image via Shutterstock

For the American middle class, wage stagnation has been a fact of life for over two decades. Last year, the median household earned just over $50,000—no more, adjusted for inflation, than the median household in 1996 or 1989. That’s in stark contrast to the fortunes of the richest one percent, who saw their annual income rise 50 percent in the same period, from about $592,000 to nearly $879,000.

At the same time, the total compensation received by workers has actually increased over 30 percent since 1980—a statistic frequently cited by conservative economists as proof that income inequality is somehow exaggerated. But the fact is, most middle class families haven’t seen a dollar of that extra compensation. It’s consumed before it ever reaches them by the ever-rising cost of health care—the silent killer of middle class wage growth.

READ MORE

The Collapse of Funding for Public Higher Education: What Quartz Missed On the Student Debt Story

Blog Post by: Benjamin Landy, on May 1, 2013

Source: New York Times

Over at Quartz, Matt Phillips has a good post summarizing "everything you need to know" about the student loan story (in 17 charts, of course). All the usual data points are there—the massive upswing in total student debt as more students clamber for an ever-more expensive degree; the recent surge in delinquencies as millions of underemployed twenty-somethings fail to make their payments on time; the growth of the federal student lending market in response to the financial crisis.

But what is missing in Phillips' post, as in too many articles about student borrowing, is any acknowledgement of two critical facts. First, three out of four undergraduates in the United States attend a public college or university—only about 15 percent attend the costlier private schools that get so much attention in the press. And second, state funding for those public colleges and universities has collapsed over the last two decades, forcing students and their families to pay the difference.

READ MORE

How the Senate Killed Gun Control In One Map

Blog Post by: Benjamin Landy, on April 19, 2013

Despite broad support from the American public, the bipartisan Manchin-Toomey amendment to extend background checks died in the Senate yesterday, six 'ayes' short of the 60 votes needed to overcome a Republican filibuster. But partisan politics is only one reason why the gun vote failed. More important is the institutional structure of the Senate itself, which by its very design (two senators per state) gives disproportionate representation and political power to small populations in large, rural states.

If you readjust the map of the United States to reflect states' actual populations, it becomes clearer that gun control legislation was defeated not only by a minority of senators, but also by an undemocratic minority of Americans.

READ MORE

Graph: How Rising Student Debt Is Preventing Millennials from Becoming Homeowners

Blog Post by: Benjamin Landy, on April 18, 2013

Image via Shutterstock

For policymakers worried about the effect of America's trillion-dollar student debt on the economy, one of the biggest concerns is that borrowers are taking out such large loans—over $26,000 on average—that it may be years or even decades before today's indebted youth can afford to buy a new car or put a down payment on a house. That could spell serious trouble for the housing market—a major driver of growth that relies on a constant stream of new homeowners to bid up property values and generate wealth—and the U.S. economy at large.

READ MORE

Graph: America’s Long-Term Unemployment Crisis Continues

Blog Post by: Benjamin Landy, on April 15, 2013

In the three and a half years since the U.S. unemployment rate peaked at 10 percent, the labor market has undergone two significant changes. First, about 7.5 million people dropped out of the labor force—about 25 percent more than the number who found a job in the same period. Around one third of those who stopped looking for work were retiring baby boomers, the first of their generation to leave the workforce en masse; the rest younger or disabled workers unable to find suitable jobs.

The second, interrelated phenomenon has been the unprecedented surge in long-term unemployment, defined as the number of workers unemployed 27 weeks (about six months) or longer. While that number has fallen by 2 million from its 2010 peak, when 6.7 million Americans counted themselves among the long-term jobless, today's long-term unemployment rate remains higher than at any time in the past 70 years. And because the Bureau of Labor Statistics only counts as unemployed people who have "actively looked for work in the prior 4 weeks," it is safe to assume the effective long-term unemployment rate is in fact much higher, including a sizable number of discouraged workers who regularly move in and out of the statistical labor force.

READ MORE

Graph: Can Congress Be Trusted With Tax Reform?

Blog Post by: Benjamin Landy, on April 11, 2013

With the possibility of comprehensive tax reform finally on the horizon, Senate Finance Committee Chairman Max Baucus (D-MT)—the man in charge of overseeing any revision to the nation's tax code—has found himself in the harsh glare of the national spotlight. Several media profiles in the past month have called into question the Senator's relationships with the corporate interest groups most likely to be affected by any tax changes emanating from his office. Indeed, a list of his top campaign donors, obtained from the nonpartisan Center on Responsive Politics, reads like a veritable "who's who" of Big Business: 

READ MORE

Graph: For Every Job We’ve Created Since 2011, Someone Left the Labor Force

Blog Post by: Benjamin Landy, on April 5, 2013

According to today's Bureau of Labor Statistics report, the U.S. economy added just 88,000 jobs in March, well below analysts' expectations and a major deceleration from the 268,000 jobs added in February. And while the official unemployment rate ticked down a tenth of a point to 7.6 percent, the drop was almost entirely attributable to the 496,000 Americans who left the labor force last month, bringing the share of the population working or looking for work to 63.3 percent, the lowest level in decades.

READ MORE

Graph: Why Democrats Need to Push Back on Social Security

Blog Post by: Benjamin Landy, on April 4, 2013

Source: New America Foundation

After years of calling for benefits cuts as a way to "strengthen" Social Security, Republicans found an unlikely ally last December in Barack Obama, when the newly reelected president put chained-CPI "on the table" in an effort to negotiate a bipartisan budget deal ahead of the fiscal cliff. House Minority Leader Nancy Pelosi (D-CA) quickly took charge of selling the cut (the result of indexing regular cost-of-living adjustments to a less generous measure of inflation, thereby reducing benefits over time) to her fellow Democrats, arguing on MSNBC that it was "worth making a compromise" and that "Democrats will stick with the president"—although, she conceded, "maybe not every single one of them."

READ MORE

Graph: As State Funding For Higher Education Collapses, Students Pay the Difference

Blog Post by: Benjamin Landy, on March 21, 2013

When tax revenue dried up in the wake of the Great Recession, states across the country decided to slash funding for public higher education, thereby passing a massive "tax" on to the students themselves. The results, according to a new report from the Center on Budget and Policy Priorities, have been severe: Five years after the recession, every state except for North Dakota and Wyoming is spending less per student on higher education than they did before.

Tuition increases have made up only part of the revenue loss resulting from state funding cuts. Public colleges and universities also have cut faculty positions, eliminated course offerings, closed campuses, shut down computer labs, and reduced library services, among other cuts.

Some states have cut deeper than others. Between 2008 and 2013, thirty-six states cut funding for public higher education by more than 20 percent, eleven cut funding by more than a third, and two states—Arizona and New Hampshire—cut their spending per college student in half.  

Click READ MORE to view the full graph for all fifty states.

READ MORE

Graph: The Wealth Gap Between Blacks and Whites Has Tripled Since 1984. Here’s Why.

Blog Post by: Benjamin Landy, on March 1, 2013

Comparing million-dollar bonuses for bankers to stagnant middle-class wages is a popular way to measure income inequality in the United States. But this narrow focus on wages and compensation fails to capture the wide range of forces driving inequality, especially along racial lines. A better method, according to a report released Wednesday by Brandeis University's Institute on Assets and Social Policy, is to compare net household wealth, which combines financial assets, such as a home or 401(k), with liabilities, such as credit card debt. 

"Wealth," the report's authors write, "allows families to move forward by moving to better and safer neighborhoods, investing in businesses, saving for retirement, and supporting their children's college aspirations." But rising wealth inequality threatens to divide communities, undermining both family well-being and economic growth:  

In the U.S. today, the richest 1 percent of households owns 37 percent of all wealth. This toxic inequality has historical underpinnings but is perpetuated by policies and tax preferences that continue to favor the affluent. Most strikingly, it has resulted in an enormous wealth gap between white households and households of color. In 2009, a representative survey of American households revealed that the median wealth of white families was $113,149 compared with $6,325 for Latino families and $5,677 for black families. 

READ MORE

Page 1 of 8 pages  1 2 3 >  Last ›

Stay Informed

Sign up for our mailing list and stay up-to-date on the latest happenings at The Century Foundation

Sign up Today

Featured Fellow

Michael Likosky
Michael Likosky

Likosky is an expert on infrastructure, energy, financial crisis and reinvestment, high tech and industrial growth, oil and gas, mining, and political risk:

View the work of Michael Likosky
View all Fellows and Experts

TCF Bookstore

The TCF Bookstore is a curated collection of books and magazines that backup the mission of our organization.

Visit Our Bookstore

Upcoming Events

Twitter Chat: Why Being a Straight White Man Is Like Playing a Video Game on Easy Mode
May 3, 2013 1 p.m.The Century Foundation will chat with Samantha Allan (@CousinDangereux) about her #TCFBest post “All Skulls On: Teaching Intersectionality through Halo.” Join the conversation at #TCFBest on Twitter.
Strengthening Community Colleges and Restoring the American Dream
May 23, 11:00am to 12:30pmPlease join us for the release of the report of The Century Foundation Task Force on Preventing Community Colleges from Becoming Separate and Unequal. The event, Bridging the Higher Education Divide: Strengthening Community Colleges and Restoring the American Dream, will take place May 23.
Twitter Chat Doubleheader: Guns and Terror at 2, Austerity at 4
April 25, 2013 2:00 p.m.The Century Foundation hosts two Twitter chats. Join us at #RealThreats at 2 p.m., and at #TCFBest at 4 p.m. (both EDT).

View All Upcoming Events

All Content Copyright © 2013 The Century Foundation

New York City Office: One Whitehall St., Fifteenth Floor, NY, NY 10004  |  DC Office: 1333 H Street, NW, 10th Floor, Washington, DC 20005